I thought this problem shows how to use average in a great way.All of us college students could use this problem for our classes.
To get an A in math class John must average 93 on 6 test. John scores on the first five test 95, 100, 86, 93, 92. What is the lowest score that he can get on the last test in order to still get an A.
The total of john's six test scores must total 558 or more top average 93.
1) Add up his first five test.
95+100+86+93+92 = 466
2)Take the difference between 558 and 466 to see what he needs on the next test.
558-466 = 92
John must score a 92 on his last test to get on A.
Wednesday, October 2, 2013
Tuesday, October 1, 2013
Math Manipulatives
Using math manipulative can help students a great amount. It can just be a physical object for adding and subtracting or tangrams for fractions. Having a physical object to play with and look at can be a fun and easier way for students to learn. Rather than using just a boring flat piece of paper.

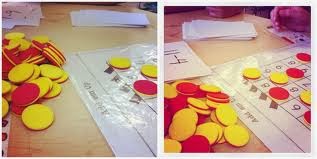
Tangrams

Chips
Here are some great websites to look at and buy some math manipulative for in your classroom.
Monday, September 30, 2013
Math Games
There's this really great website that has free math games. It separates it by grades or type of math. For example they have first grade two digit addition. This website also has different math sheets teachers can print out and use for their class.
http://www.math-play.com/
http://www.math-play.com/
Standard Deviation
Standard deviation shows the variation from your data. Here is a math problem to give an example of how to find standard deviation based on collected data.
Seven students on an intramural team weigh 148 lb, 155 lb, 143 lb, 154 lb, 145 lb, 164 lb and 141 lb. What is the standard deviation of the weight of these students.
1) Find the mean.
148+155+143+154+145+164+141 = 150
7
2) Subtract the mean from each of the weights.
148-150 = -2
155-150 = 5
143-150 = -7
154-150 = 4
145-150 = -5
164-150 = 14
141-150 = -9
3) Square each of the differences from step 2.
(-2)^2 = 4
(5)^2 = 25
(-7)^2=49
(4)^2 = 16
(-5)^2 = 25
(14)^2 = 196
(-9)^2 = 81
4) Add up all your answers from step 3.
4+25+49+16+25+196+81 = 396
5)Divide the sum from step 4 by the number of weights to get the variance.
396 =56.571
7
6) Square the answer from step 5 to find the standard deviation.
56.571 = 7.5
7
Your standard deviation is 7.5
Saturday, September 28, 2013
Mean, Median, and Mode
The figure below contains the salaries of different employees at a job. What is the mean, median, and mode.
Number Type Salary
1 owner $26,900
5 Sales Person $18,900
3 Secretary $16,100
1 Custodian $11,000
Mean
First you multiply the number of people in the area of work by the salary that area of work makes. This gives you the total cost for each area of work.
1 * 26,900 = 26,900
5 * 18,900 = 94,500
3 * 16,100 = 48,300
1 * 11,000 = 11,000
Then you add up all the total cost. This finds the sum of all the employees makings.
26,900 + 94,500 + 48,300 +11,000 = 180,700
Finally you divide it by the total number of employees. To Find your mean.
180,700 = 18,070
10
Median
First you have to place all your salaries from least to greatest.
11,000 16,100 16,100 16,100 18,900 18,900 18,900 18,900 18,900 26,900
Then you find the one in the middle and that is your median.
Mode
The mode is the salary that appears the most.
In this case it is 18,900
Saturday, September 21, 2013
Transforming Graphs
I learned how to turn a bar graph into a pie chart. I think its a good way to show your class how to use the same information in different ways. It also gives them different charts to chose from according to which one they feel more comfortable using.
How to turn a Bar Graph into a Pie Chart

 Here is a great website to make free graphs and charts.
http://www.chartgo.com/
How to turn a Bar Graph into a Pie Chart
- You have to gather your data and make a bar graph out of it.
- You cut the bars out and tape them all together in one long line.
- You then connect the ends of the line together to create a circle.
- You trace the circle and mark you data.
- Finally you color it in and make a key.


http://www.chartgo.com/
Subscribe to:
Posts (Atom)